



Scope 1, 2, and 3 Emissions: A plain-language Guide for Indian Professionals
Of all the technical concepts in ESG practice, greenhouse gas emissions accounting generates the most confusion among practitioners who did not come to sustainability from a scientific or engineering background. The confusion is usually not about whether emissions matter, most people already understand that, but about what Scope 1, 2, and 3 actually mean, why the categories were designed that way, and what the numbers in a BRSR report actually represent.
This is an attempt to explain all three clearly, from first principles, with examples grounded in Indian industry.
Why GHG accounting uses “scopes” at all
The Scope 1/2/3 framework comes from the GHG Protocol Corporate Accounting and Reporting Standard, developed by the World Resources Institute and the World Business Council for Sustainable Development in 2001 and now the most widely used GHG accounting methodology globally. India’s BRSR GHG disclosure requirements are aligned with it.
The framework exists because carbon emissions are not a simple factory-to-atmosphere flow. A company’s climate impact is distributed across its entire value chain, from the energy it uses, to the products it makes, to how those products are used and disposed of by its customers. The three scopes are a way of organising this complexity into categories that are both analytically useful and practically measurable at different levels of rigour.
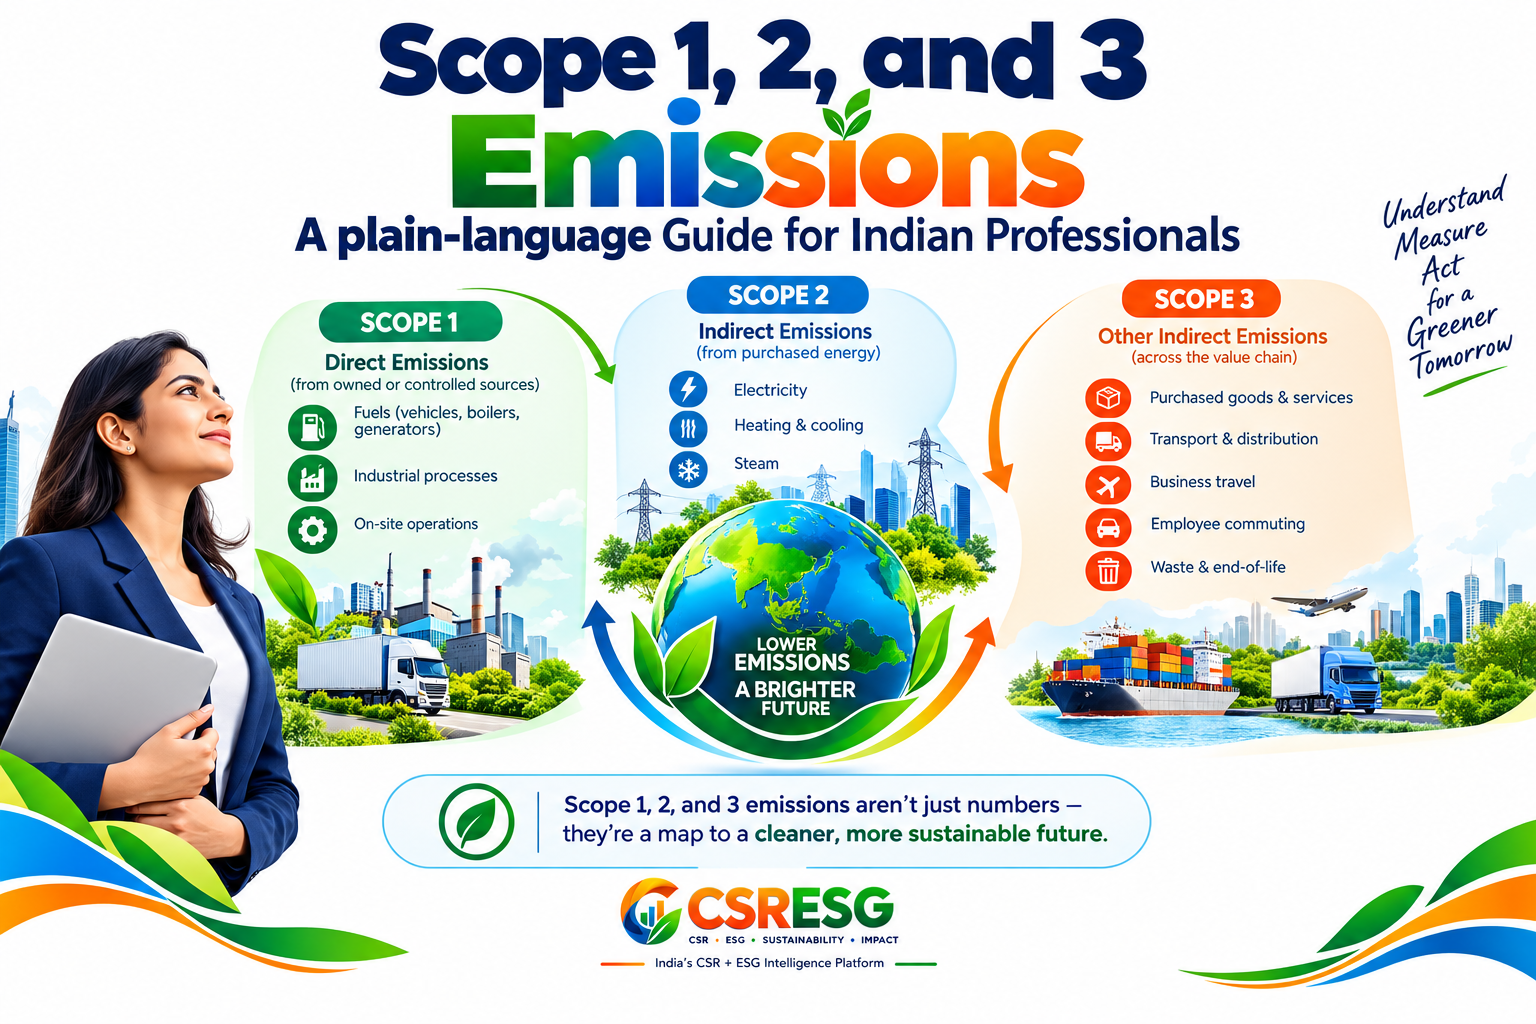
Scope 1: What the company directly emits
Scope 1 covers emissions from sources that a company owns or controls. The four categories are:
Stationary Combustion: burning fuels in boilers, furnaces, and generators at company facilities. A steel mill burning coal to power its blast furnace is a Scope 1 source. So is a pharmaceutical plant burning LPG for heating.
Mobile Combustion: fuel burned in company-owned or company-controlled vehicles, including fleet cars, delivery vehicles, forklifts, and company aircraft.
Process Emissions: emissions that result from industrial processes rather than combustion. Cement production releases CO₂ as a byproduct of the calcination of limestone, regardless of what fuel is used to power the kiln. Fertiliser production releases N₂O as a process byproduct.
Fugitive Emissions: leaks of greenhouse gases from equipment, typically refrigerants from air conditioning and cooling systems (HFCs are potent greenhouse gases), and methane from gas pipelines.
Scope 1 is the most reliably measured category because companies have direct control over and direct records of the sources. It is also where Indian companies’ BRSR disclosures tend to be most complete, fuel purchase records, process yield data, and equipment inventories are generally already maintained for operational and financial purposes.
Scope 2: what the company’s energy consumption causes
Scope 2 covers indirect emissions from the generation of purchased energy, electricity, steam, heat, or cooling, that the company consumes but does not generate itself. The emissions physically occur at the power plant or heat-generation facility, but they are attributed to the company as the consumer of that energy.
In India, Scope 2 is dominated by purchased electricity, given the still coal-heavy composition of the national grid. The emission factor for India’s electricity grid, published annually by the Bureau of Energy Efficiency (BEE) converts kilowatt-hours of electricity consumed into tonnes of CO₂ equivalent. As India’s grid becomes cleaner through renewable energy additions, this emission factor decreases over time, meaning the same kilowatt-hour of consumption produces fewer attributed emissions.
BRSR and the GHG Protocol require companies to disclose Scope 2 using two methodologies: location-based (using the average grid emission factor for the location of consumption) and market-based (using the emission factor of the specific energy contracts or certificates a company holds a company that has purchased renewable energy certificates, for example, can claim a lower market-based Scope 2 than its location-based figure). Knowing which methodology a company uses and whether they disclose both, is an important data quality check.
Scope 3: what the company’s value chain causes
Scope 3 is everything else. It covers all other indirect emissions that occur across a company’s value chain, both upstream (before the company’s gate) and downstream (after it). The GHG Protocol defines 15 categories of Scope 3, of which the most commonly material are:
Purchased goods and services, the emissions embedded in the raw materials, components, and services a company buys. For a textile manufacturer, the embedded emissions in cotton, dyes, and packaging are typically the largest single category of Scope 3 and may be ten times larger than the company’s Scope 1 and 2 combined.
Business travel and employee commuting, flights, hotel stays, and daily commuting by the workforce. For a consulting or IT firm, this is often the dominant Scope 3 category.
Use of sold products – emissions from customers using the company’s products. For an automotive manufacturer, the fuel burned in the vehicles it sells over their lifetime is Scope 3. For an energy company selling fossil fuels, the emissions from combustion by customers are Scope 3. This category is why Scope 3 matters so much for fossil fuel, automotive, and consumer electronics companies — their downstream product use emissions dwarf everything else in their carbon footprint.
End-of-life treatment – emissions from disposing of a company’s products at end of life, landfill gas, incineration, recycling energy use.
Why Scope 3 is the hardest and the most important
Scope 3 is the most important category for most companies because it is where most of the emissions actually are. Research consistently shows that for manufacturing companies, Scope 3 typically represents 70–90% of total value chain emissions. For consumer goods companies and technology companies, the proportion can be even higher.
It is also the hardest to measure. Companies do not have direct records of their suppliers’ energy use or their customers’ usage patterns. Scope 3 measurement relies on a combination of spend-based estimates (using industry-average emission factors per rupee spent on a category), hybrid methods, and supplier-specific data where companies have the supply chain relationships to request it.
In Indian BRSR filings, Scope 3 disclosure is still largely voluntary and widely incomplete. BRSR Core does not yet require Scope 3 assurance at the same level as Scope 1 and 2. This is expected to change, the trajectory of BRSR regulation is toward progressively greater value chain disclosure, but for now, the quality of Scope 3 disclosure in Indian company reports is a direct proxy for ESG ambition rather than compliance.
Reading BRSR GHG Data – What to look for
When you open a BRSR and go to the Principle 6 environmental disclosures, the data quality signals to check are:
Does the company define its organisational boundary? (Which subsidiaries and operations are included and which are excluded, and why.)
Does it disclose the emission factors used and their source? (BEE grid factor with the vintage year is the minimum for Scope 2 in India.)
Does it report both absolute emissions and intensity metrics? (BRSR Core requires intensity per rupee of turnover and per unit of physical output.)
Does it report market-based and location-based Scope 2 separately?
Does it attempt any Scope 3 categories and if so, which ones, and how are they estimated?
Is there a prior-year comparison? (Trend data matters; a single year of numbers with no baseline tells you very little.)
The answers to these questions tell you more about a company’s actual ESG maturity than the absolute emission numbers themselves. A company that can answer all six questions specifically and correctly is operating a genuine emissions management programme. A company that reports a single GHG total with no boundary definition, no emission factors, and no intensity metrics is complying with the minimum and probably not managing emissions at all.